【学習記録】Python データサイエンスハンドブック(45)
オライリーの「Pythonデータサイエンスハンドブック」の学習記録
3.12.7 事例:シアトル市の自動車数を可視化する。
#ファイル名を指定してcurlで保存する場合は「-o」を使う。備忘録参照。
In [69]: !curl -o FremontBridge.csv https://data.seattle.gov/api/views/65db-xm6k/ro
    ...: ws.csv?accessType=DOWNLOAD
  % Total    % Received % Xferd  Average Speed   Time    Time     Time  Current
                                 Dload  Upload   Total   Spent    Left  Speed
100 1679k    0 1679k    0     0   347k      0 --:--:--  0:00:04 --:--:--  378k

In [71]: data=pd.read_csv('FremontBridge.csv')
In [79]: data.columns
Out[79]: Index(['Date', 'Fremont Bridge East Sidewalk', 'Fremont Bridge West Sidewalk'], dtype='object')

#Dateをdataのインデクスに指定する。
In [81]: data=data.set_index('Date')

In [82]: data.head()
Out[82]:
                        Fremont Bridge East Sidewalk  \
Date
01/01/2019 12:00:00 AM                           0.0
01/01/2019 01:00:00 AM                           2.0
01/01/2019 02:00:00 AM                           1.0
01/01/2019 03:00:00 AM                           1.0
01/01/2019 04:00:00 AM                           2.0

                        Fremont Bridge West Sidewalk
Date
01/01/2019 12:00:00 AM                           9.0
01/01/2019 01:00:00 AM                          22.0
01/01/2019 02:00:00 AM                          11.0
01/01/2019 03:00:00 AM                           2.0
01/01/2019 04:00:00 AM                           1.0

#列名を短くする。
In [83]: data.columns=['West','East']

#WestとEastの合計の列(TOtal)を追加する。
In [84]: data['Total']=data.eval('West+East')

In [85]: data.head()
Out[85]:
                        West  East  Total
Date
01/01/2019 12:00:00 AM   0.0   9.0    9.0
01/01/2019 01:00:00 AM   2.0  22.0   24.0
01/01/2019 02:00:00 AM   1.0  11.0   12.0
01/01/2019 03:00:00 AM   1.0   2.0    3.0
01/01/2019 04:00:00 AM   2.0   1.0    3.0

#dataの要約統計を見てみる。
In [86]: data.dropna().describe()
Out[86]:
               West          East         Total
count  59823.000000  59823.000000  59823.000000
mean      52.619795     60.262324    112.882119
std       67.734326     87.871363    143.101423
min        0.000000      0.000000      0.000000
25%        6.500000      7.000000     15.000000
50%       29.000000     30.000000     61.000000
75%       70.000000     73.000000    147.000000
max      698.000000    850.000000   1097.000000
3.12.7.1 データの可視化を行う。
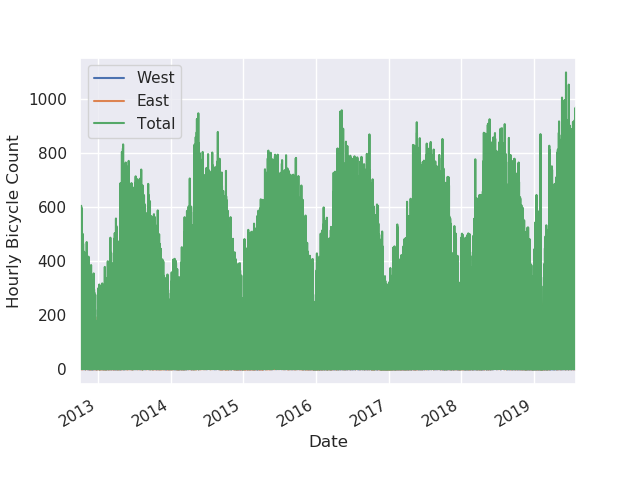
#単純にプロットしてみる。
#インデクスが見た目は時系列だけど、dypeはobjectになっているので、思ったようなグラフにならない。
In [87]: %matplotlib
Using matplotlib backend: TkAgg

In [88]: import seaborn; seaborn.set()

In [89]: data.plot()
Out[89]: <matplotlib.axes._subplots.AxesSubplot at 0x7f7e7aa4bfd0>

In [90]: plt.ylabel('Hourly Bicycle Count')
Out[90]: Text(27.625, 0.5, 'Hourly Bicycle Count')

In [93]: data.index
Out[93]:
Index(['01/01/2019 12:00:00 AM', '01/01/2019 01:00:00 AM',
       '01/01/2019 02:00:00 AM', '01/01/2019 03:00:00 AM',
       '01/01/2019 04:00:00 AM', '01/01/2019 05:00:00 AM',
       '01/01/2019 06:00:00 AM', '01/01/2019 07:00:00 AM',
       '01/01/2019 08:00:00 AM', '01/01/2019 09:00:00 AM',
       ...
       '12/06/2016 12:00:00 AM', '01/22/2016 08:00:00 PM',
       '04/04/2017 01:00:00 AM', '01/18/2013 04:00:00 AM',
       '01/12/2017 04:00:00 AM', '02/29/2016 12:00:00 AM',
       '09/13/2013 03:00:00 AM', '12/07/2016 12:00:00 AM',
       '03/29/2013 04:00:00 AM', '05/24/2017 01:00:00 AM'],
      dtype='object', name='Date', length=59832)

#インデクスの dtypeをdatetime64に変換してからプロットする。
#思い通りのグラフができる。
In [95]: data.index=pd.DatetimeIndex(data.index)

In [96]: data.index
Out[96]:
DatetimeIndex(['2019-01-01 00:00:00', '2019-01-01 01:00:00',
               '2019-01-01 02:00:00', '2019-01-01 03:00:00',
               '2019-01-01 04:00:00', '2019-01-01 05:00:00',
               '2019-01-01 06:00:00', '2019-01-01 07:00:00',
               '2019-01-01 08:00:00', '2019-01-01 09:00:00',
               ...
               '2016-12-06 00:00:00', '2016-01-22 20:00:00',
               '2017-04-04 01:00:00', '2013-01-18 04:00:00',
               '2017-01-12 04:00:00', '2016-02-29 00:00:00',
               '2013-09-13 03:00:00', '2016-12-07 00:00:00',
               '2013-03-29 04:00:00', '2017-05-24 01:00:00'],
              dtype='datetime64[ns]', name='Date', length=59832, freq=None)

In [97]: data.plot()
Out[97]: <matplotlib.axes._subplots.AxesSubplot at 0x7f7e593aaa20>

In [98]: plt.ylabel('Hourly Bicycle Count')
Out[98]: Text(22.375, 0.5, 'Hourly Bicycle Count')

#毎時データではギザギザなので、毎週データに再サンプリングする。
In [99]: weekly=data.resample('W').sum()

In [100]: weekly.plot(style=[':','--','-'])
Out[100]: <matplotlib.axes._subplots.AxesSubplot at 0x7f7e4c597b38>

In [101]: plt.ylabel('Weekly bicycle count')
Out[101]: Text(12.500000000000002, 0.5, 'Weekly bicycle count')

In [102]: weekly.head()
Out[102]:
              West    East    Total
Date
2012-10-07  7297.0  6995.0  14292.0
2012-10-14  8679.0  8116.0  16795.0
2012-10-21  7946.0  7563.0  15509.0
2012-10-28  6901.0  6536.0  13437.0
2012-11-04  6408.0  5786.0  12194.0

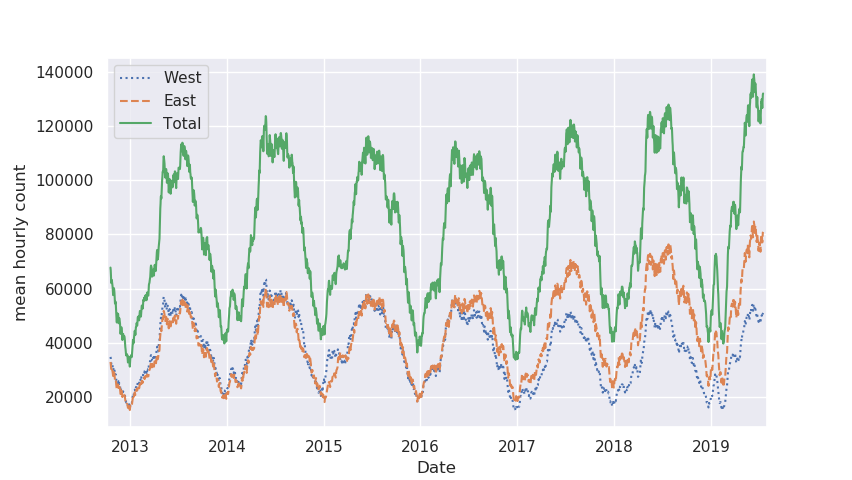
#30日間の移動平均を行い、1日当たりの平均を求める
#30日間の合計のグラフを作成する。

In [103]: daily=data.resample('D').sum()

In [104]: daily.head()
Out[104]:
              West    East   Total
Date
2012-10-03  1760.0  1761.0  3521.0
2012-10-04  1708.0  1767.0  3475.0
2012-10-05  1558.0  1590.0  3148.0
2012-10-06  1080.0   926.0  2006.0
2012-10-07  1191.0   951.0  2142.0

In [105]: daily.rolling(30,center=True).sum().plot(style=[':','--','-'])
Out[105]: <matplotlib.axes._subplots.AxesSubplot at 0x7f7e4c4c2828>

In [106]: daily.rolling(30,center=True).sum().plot(style=[':','--','-'])
Out[106]: <matplotlib.axes._subplots.AxesSubplot at 0x7f7e7acbbf60>

In [107]: plt.ylabel('mean hourly count') #これはたぶん図書の誤植で、mean every 30 days countが正しい。
Out[107]: Text(2.8750000000000018, 0.5, 'mean hourly count')

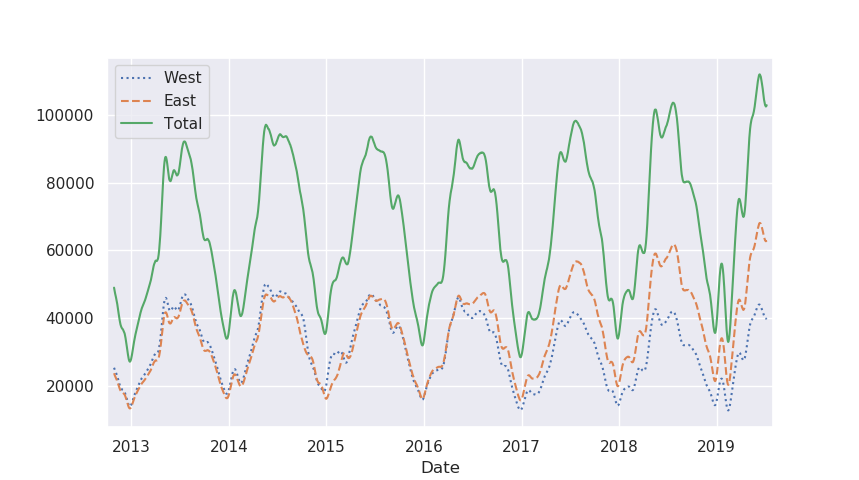
#窓関数をガウス窓にすると、滑らかな移動平均を求めることが可能。
#↓のコードでは、ウィンドウの幅(50日)とウインドウ内のガウスの幅(10日)の両方を指定している(←要学習。)
In [108]: daily.rolling(50,center=True, win_type='gaussian').sum(std=10).plot(style
     ...: =[':','--','-'])
Out[108]: <matplotlib.axes._subplots.AxesSubplot at 0x7f7e4c1f4898>


Pythonデータサイエンスハンドブック ―Jupyter、NumPy、pandas、Matplotlib、scikit-learnを使ったデータ分析、機械学習
- 作者: Jake VanderPlas,菊池彰
- 出版社/メーカー: オライリージャパン
- 発売日: 2018/05/26
- メディア: 単行本(ソフトカバー)
- この商品を含むブログを見る